Finding the Metric that Matters
You should measure everything (well, almost). But, at the same time, you don’t want to end up with data vomit or vanity metrics.
Finding the needle in the data haystack can be tricky. The Lean Growth Canvas helps you structure your data. There are (at least) three different “data buckets” to use when starting to organise your KPIs.
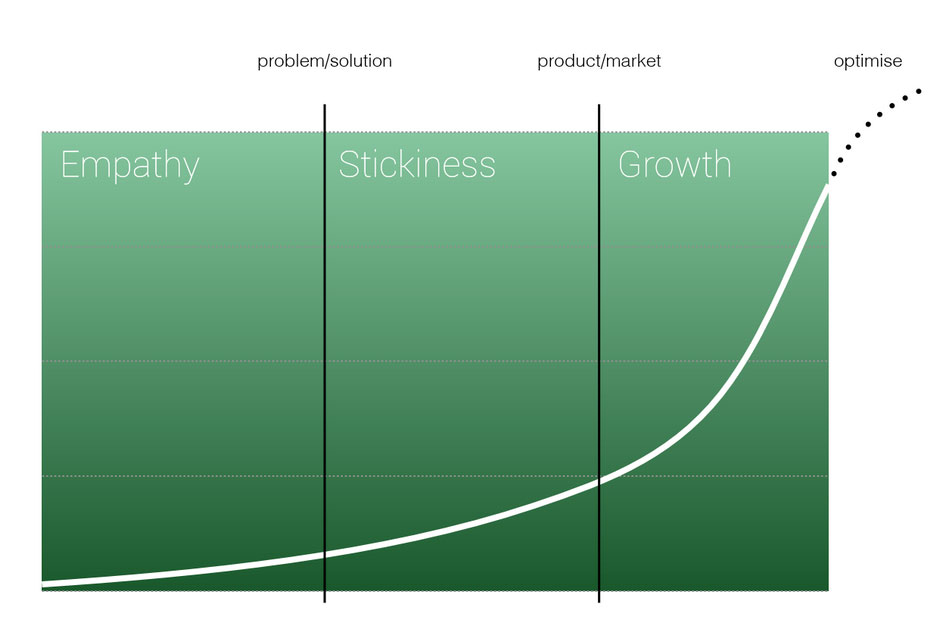
- The Business Performance (BP) metric. This is your most important metric as it shows how well your business is performing. Note, however, that it can be different depending on what startup stage you are in (exploring or growing – see the graph above?). It rarely changes and is usually measured in money. Lifetime Value of a Customer is a typical BP metric.
- The Product Experience (PX) metric. This is where you pick one key metric of your product experience that you suspect is a leading indicator of your BP and start chasing it. You should constantly be questioning this metric and change it as soon as you see it’s not leading to BP growth.
- Growth Hacking (GH) metrics. Now you are on the detail level, doing A/B-testing and optimising user flow. This metric should be changed as often as possible, preferably daily. You should constantly be looking for leaks in the funnel and optimisation points. Again, the Lean Growth Canvas helps you look for leaks.
As you can see, the rate of change is different for the three buckets. The first bucket you rarely change. The second more often and the third as often as possible.
Can you think of other “buckets” of data and other types of metrics? Let us know in the comments.